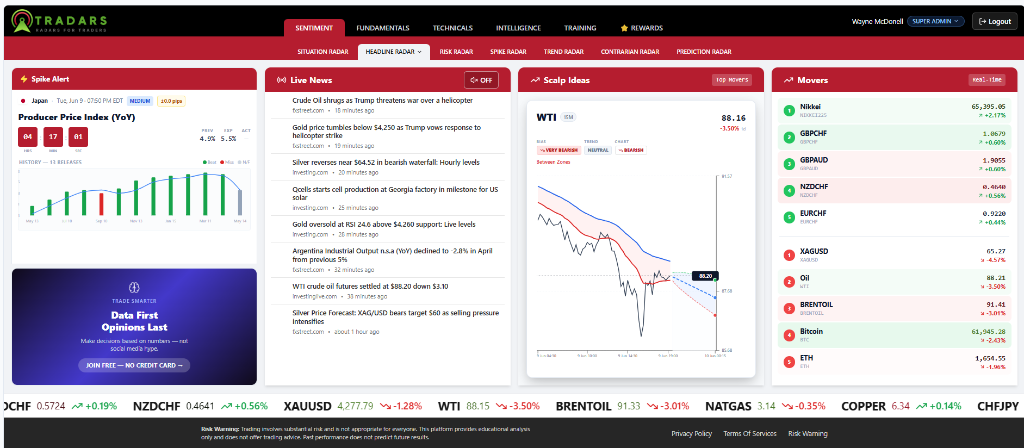

Turn market data into confident trading decisions
With 10,000+ traders already using it and 100% free access to institutional-grade data, TRADARS gives you everything you need to trade with confidence. The result: smarter entries and higher conviction.
Powered by Official Government & Institutional Data Sources
You're Not Alone If You've Ever Felt...
Constant Uncertainty
Is this the right trade? Did I miss something? What if there is news I do not know about?
Information Overload
Too many charts, too many conflicting signals, social media noise drowning out real data.
Getting Blindsided
Market moved against me again. I had no idea that news was coming. Why did I not see this?
From Chaos to Calculation
We don't just give you charts. We give you the mathematical probability behind the move.
❌ The Old Way (Noise)
- • Subjective trendlines drawn by "feel"
- • Conflicting indicators (RSI says buy, MACD says sell)
- • Reacting to news headlines 5 minutes too late
- • Zero mathematical validation of risk
✅ The TRADARS Way (Math)
- Institutional Positioning: COT Net Longs > 2 Standard Deviations
- Economic Z-Score: Growth + Inflation delta favors LONG bias
- Correlation: 0.89 correlation with 10Y Yields confirms move
- Calculated Risk: Volatility-adjusted sizing based on ATR
This Isn't a Demo. This Isn't a Trial.
This Is Professional-Grade Analytics.
Most platforms make you pay $99-$200/month for these tools. We give them to you FREE.
Here's exactly what you get instant access to:
Live Squawk Box
Real-time audio market commentary from professional traders. Get instant alerts on breaking news, economic data releases, and market-moving events as they happen.

✓ Professional audio commentary
✓ Breaking news alerts
✓ React faster than the market
Swing Trades Radar
AI-powered pattern recognition scanning 100+ instruments to find the highest probability setups right now. Institutional-grade technical analysis delivered to you.
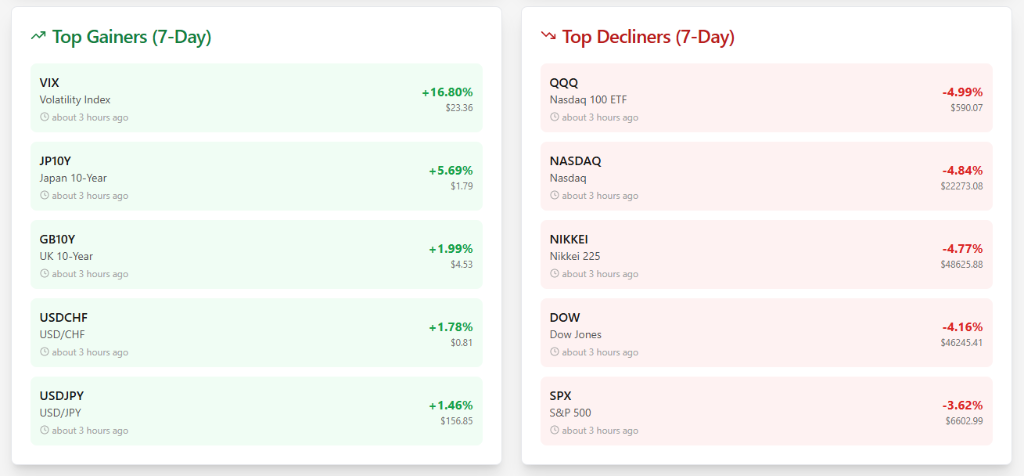
✓ AI pattern recognition
✓ Highest probability setups
✓ Professional-grade analysis
Scalping Radar
Real-time momentum scanner identifying short-term breakouts and scalping opportunities across all major pairs. Perfect for day traders and scalpers.
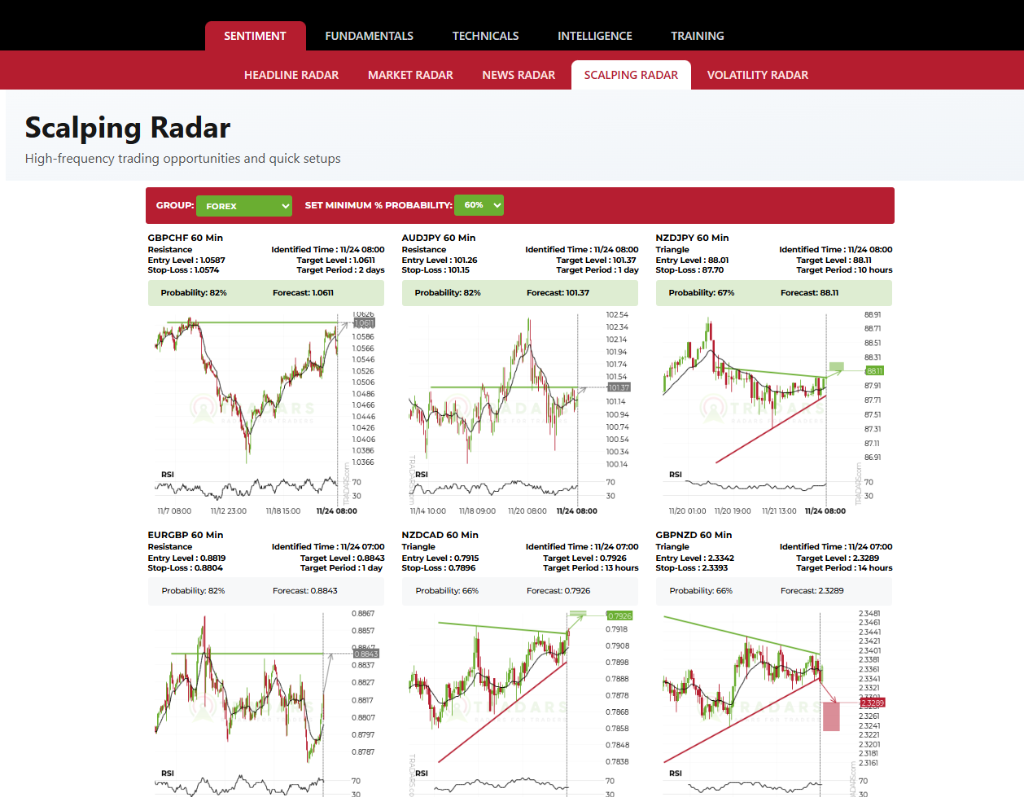
✓ Real-time momentum alerts
✓ Breakout identification
✓ Perfect for day trading
Implied Volatility Radar
Track market fear and volatility expectations across currencies, indices, and commodities. See when the market is pricing in major moves before they happen.
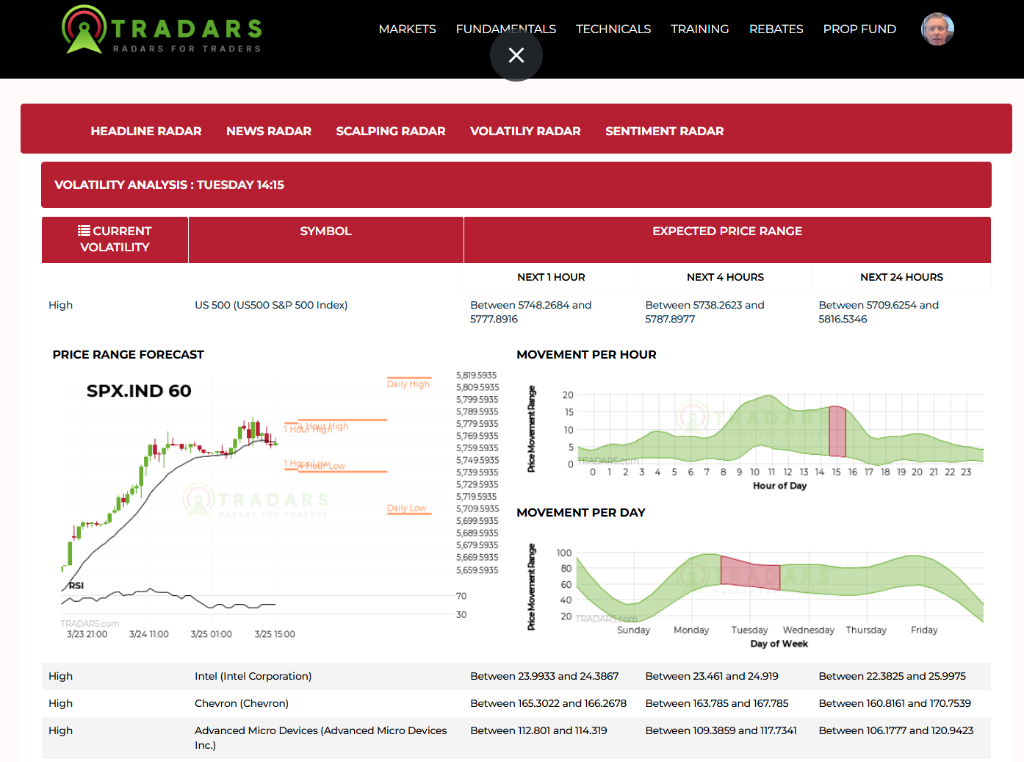
✓ Market fear gauge
✓ Volatility expectations
✓ Anticipate major moves
Real-Time Market Radar
Track every major market in one place. Forex, indices, commodities, crypto—all updating live with price alerts and momentum indicators.
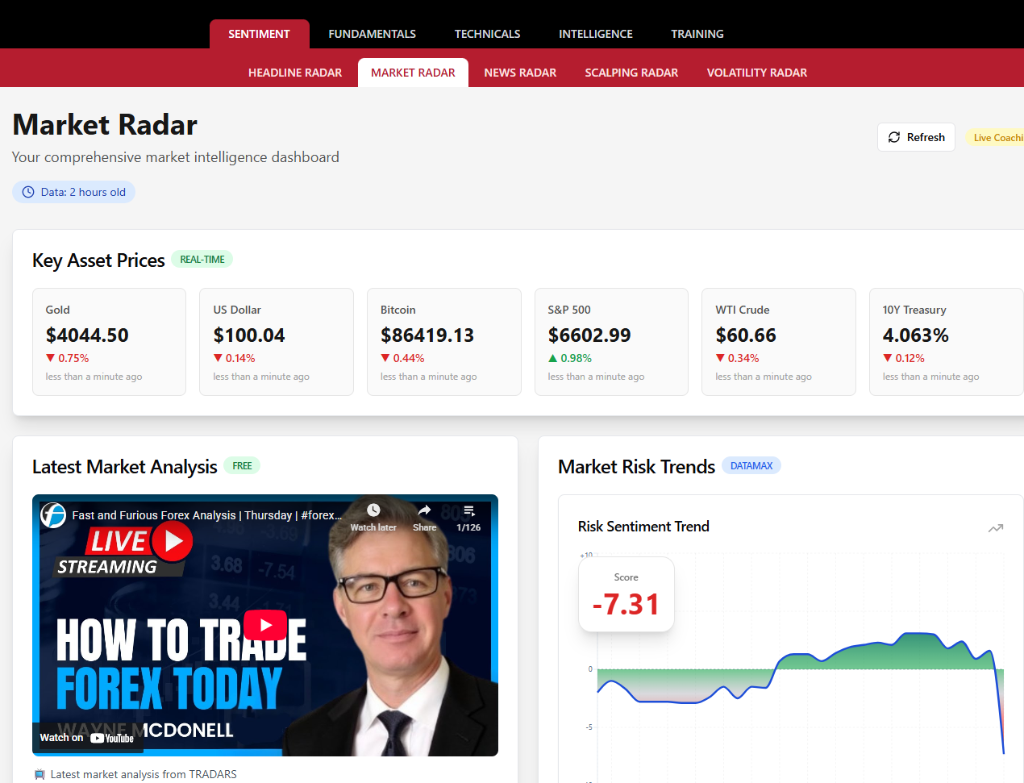
✓ All markets in one view
✓ Real-time price updates
✓ Momentum indicators
Institutional Positioning (COT)
See where hedge funds and large speculators are positioned using official CFTC reports. Follow the smart money, not the crowd.
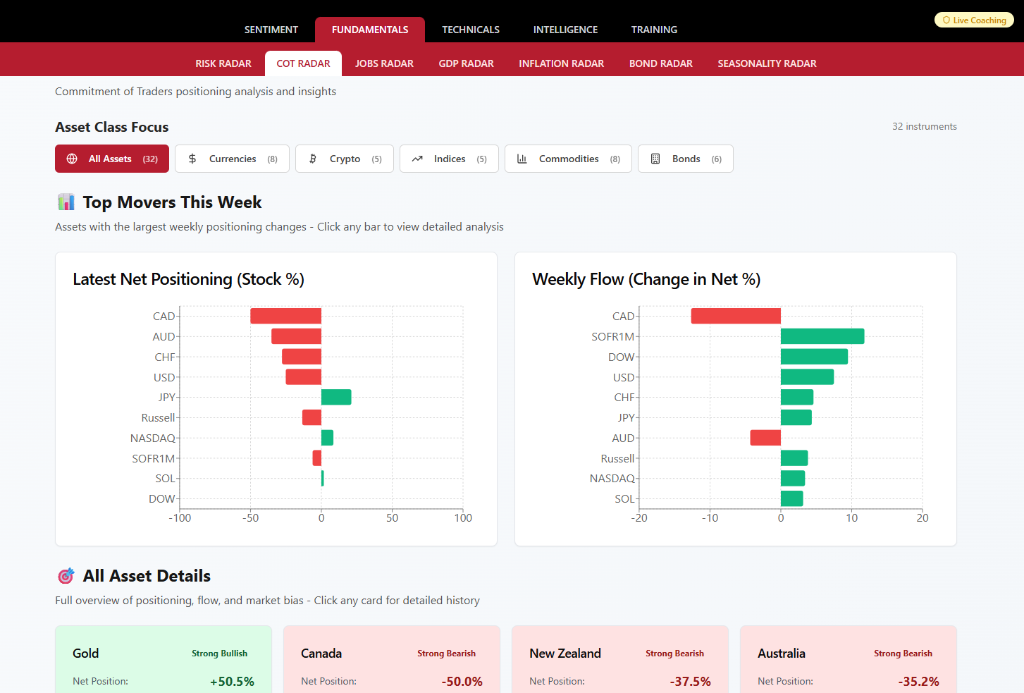
✓ Official CFTC data
✓ Hedge fund positioning
✓ Follow smart money
And This Is Just the FREE Tier
Most platforms charge $99-$200/month for what we give you free. Why? Because we believe every trader deserves access to real data.

Harvard-Trained Economist
with 20+ Years Experience
Wayne McDonell isn't just another trading guru. He's a Harvard-educated economist who spent decades analyzing markets for institutional investors. Now, he's making that same level of analysis accessible to individual traders like you.
Your First 5 Minutes with TRADARS
Here's exactly what happens when you sign up (takes 60 seconds):
Enter Your Email
No credit card. No phone number. Just your email. We send you instant access.
Explore the Platform
Dive into live market data, economic calendar, news feed—everything unlocked immediately.
Make Better Trades
Start using real data to validate your ideas. Feel the confidence that comes with knowing.
Real members. Real clarity. Real confidence.

Denise was a professional floor trader during Black Monday... the day of the 1987 stock market crash! Today she uses TRADARS to find trades using long-term economic fundamentals.

Jim has been an active trader and investor for several decades. He looks through his charts to find trading opportunities and then uses TRADARS to qualify them before he pulls the trigger... like a true Marine!

Lucas has a passion for trading, but as a farmer, he spends more time in the tractor than his trading desk. He uses TRADARS to filter through noise and focus on his fundamental trading bias. Its a huge time saver!
How You'll Feel After Just One Week
These are real emotions our free members describe:
Confident
"I finally understand what's driving the markets. I'm not second-guessing every trade anymore."
Prepared
"No more panic when unexpected news drops. I see it coming on the calendar. I'm ready."
Empowered
"I have the same data as professional traders. I'm not at a disadvantage anymore."
And this transformation starts the moment you sign up.
What You're Getting vs What You'd Pay Elsewhere
We compared TRADARS FREE to popular paid platforms. Here's what we found:
| Feature | Other Platforms ($99-200/mo) | TRADARS FREE ($0/mo) |
|---|---|---|
| Real-time market data | ✗ Usually delayed 15-20 min | ✓ Live updates |
| Economic calendar | ✓ Basic only | ✓ Full calendar |
| COT institutional data | ✗ Premium only | ✓ Included free |
| Live news feed | ✓ Limited headlines | ✓ Full access |
| Multiple asset classes | ✗ Usually 1-2 only | ✓ Forex, stocks, crypto, commodities |
| Setup time | 10-30 minutes | 60 seconds |
| Monthly Cost | $99-$200 | $0 |
Better Than Paid Tools
The Market Does Not Wait.
Neither Should You.
Setup takes 60 seconds. Access is instant. The question is: what are you waiting for?
No credit card required • Cancel anytime • Upgrade only if you love it
Love the Free Tier? Unlock Even More Power.
We also offer premium plans with advanced features for serious traders.
But start with FREE—see if you love it first.
Meet Aiden: Your 24/7 Institutional Trading Mentor
Imagine having a Harvard-trained economist sitting next to you every time you trade. Aiden is trained on 20 years of Wayne McDonell's economic models to give you instant, data-driven guidance.
Feature 1: Ask Aiden
Stuck on a trade? Not sure what the news means? Just ask. Aiden doesn't just give answers; he teaches you the "why" behind market moves.
You: "Why is EURUSD dropping today?"
Aiden: "Real yields in the US are rising faster than Europe due to today's strong CPI print (+0.4%), driving capital flows into the Dollar. The institutional bias is now Bearish."
Feature 2: Grade My Trade
Upload a screenshot of your trade plan and get a complete technical and fundamental breakdown with a confidence score. Aiden teaches you how to connect economic data points with technical analysis to confirm high-probability opportunities.
You: "Thinking of buying Gold here."
Aiden: "Caution. Success Probability: Low. Real yields are up +5bps today and COT data shows hedge funds are net short. Waiting for a pullback to 1950 is safer."
Analyzing Market Conditions...
- • VIX: Trending Up (18.5)
- • Put/Call Ratio: Bearish (1.2)
- • Fed Liquidity: Net Draining
Verdict: Yes. The setup matches our "Risk-Off" criteria. Volatility is expanding while liquidity contracts. Look for resistance at 4450.
Based on the daily ATR (Average True Range), a volatility-adjusted stop should be placed at 4485. This keeps you out of random noise but protects capital if the trend reverses.
Advanced COT Analysis
Deep-dive institutional positioning tools, historical comparisons, and divergence scanners to follow the smart money.
Seasonality with Projections
Identify recurring market patterns and seasonal trends with AI-powered projections to time your entries and exits perfectly.
Live Daily Coaching
Join live webinars with Harvard economist Wayne McDonell. Get real-time market analysis and direct coaching.
Live Daily Coaching with Professional Traders
Join live daily webinars, get direct coaching from our expert team, and become part of an exclusive private trading community.
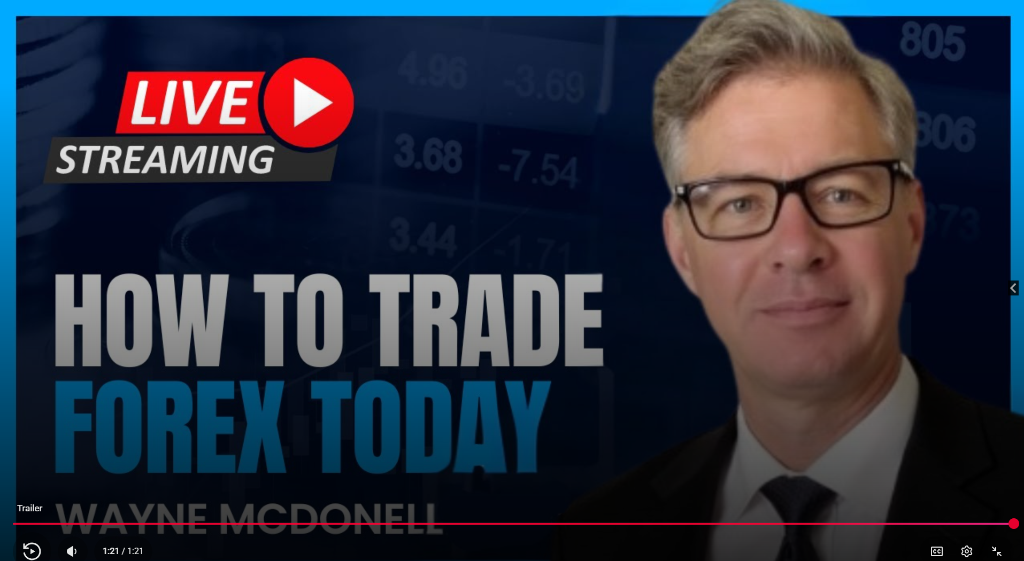
Wayne
Chief Economist
20 Years Trading Experience
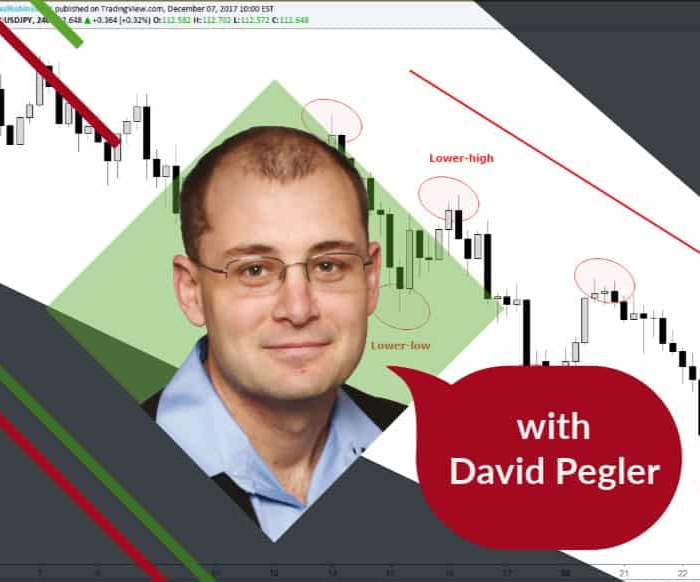
David
Forex Coach
15 Years Trading Experience
Bryan
Cryptocurrency Coach
10 Years Trading Experience
Peter
Stock Index Coach
10 Years Trading Experience
Mayda
Community Manager
5 Years Trading Experience
Live Daily Webinars
Join our coaches every trading day for live market analysis, trade ideas, and Q&A sessions.
Private Community
Connect with serious traders, share ideas, and get support from fellow members and coaches.
Direct Coaching
Get personalized feedback on your trades and strategies from our expert coaching team.
Free
- Headline Radar
- Market Radar
- News Feed
- Basic COT Data
- Economic Calendar
Essentials
- Everything in Free
- Full COT Analysis
- Jobs & GDP Data
- Inflation Tracking
- Bond Yields
DataMax
- Everything in Essentials
- Seasonality Radar
- Economic Scorecards
- Full Historical Data
- Correlation Matrix
AI Strategist
- Everything in DataMax
- Ask Aiden AI
- Grade My Trade
- Unlimited AI Analysis
- Priority Support
Live Coaching
- Everything in AI
- Live Daily Webinars
- Direct Coaching
- Private Community
- Wayne & Team Access
All plans include access to official government data sources • Cancel anytime • No long-term contracts
An Open Letter to All Traders
"If the markets seem random and your trading is random, there is no mathematical possibility that you will make consistent returns."

Wayne McDonell
Dear Fellow Traders,
I am writing this to you because I know exactly what you are feeling right now.
I know the excitement of placing that first trade. The rush of adrenaline. And I know the crushing, sinking feeling that follows when the market suddenly turns against you for no apparent reason. You stare at the charts, you check your indicators—the RSI was oversold, the MACD crossed over, the support level held... so why did you lose?
You feel like you are missing a piece of the puzzle. Like there is a secret club of profitable traders and you are on the outside looking in.
You are right. There is. But it's not about secret indicators or magic patterns.
My journey from amateur to professional wasn't a straight line. It was years of frustration. When I started as a foreign exchange trader, there were no books, gurus or courses. I had to figure it out with brute force.
It wasn't until later, during my time at Harvard, that I truly understood the power of their motto: VERITAS.
Veritas means more than just Truth. It means Truth through Knowledge. You only know the truth because you are knowledgeable.
In trading, this means knowing why the markets are moving because you have access to and understand the data. It's not a guess or a feeling... it's the facts. It's the truth.
Once I understood this, everything changed. I stopped trying to predict the unpredictable. I got inside.
I started working with institutional funds. I saw how the "Big Boys" trade. And do you know what I found?
They weren't looking at RSI. They weren't drawing trendlines on a 5-minute chart.
They were looking at Data. Real, hard economic data. They knew where the money was flowing before price ever moved. They treated trading not as a game of chance, but as a serious business of probability.
You Cannot Do This Alone
Trading is the most competitive business in the world. You are up against multi-billion dollar hedge funds with armies of analysts, supercomputers, and endless capital.
And you are sitting there, alone, guessing. That is not a fair fight. It is financial suicide.
But what if you could level the playing field? What if you could have that same army of analysts working for you?
That is why I built TRADARS. I wanted to give you the team I wished I had.
Your New Professional Team:
- Me (Wayne McDonell): I will be your Chief Economist. I will parse the Federal Reserve speeches, the GDP reports, and the global macro trends so you don't have to get a Harvard degree to understand them.
- Aiden (Your AI Strategist): Imagine an analyst who never sleeps, never gets emotional, and has memorized every piece of economic data for the last 20 years. That is Aiden. He is there to validate your trade ideas 24/7.
- The Coaching Staff: Real, vetted professional traders who are in the trenches every day. They are there to hold your hand, correct your mistakes, and keep you disciplined.
We take millions of data points—COT reports, bond yields, central bank policies—and we translate them into simple, logical trade plans.
We turn "I think gold might go up" into "Gold is a buy because real yields are falling, central banks are accumulating, and the COT report shows hedge funds are aggressively adding longs."
See the difference? One is a guess. The other is a business decision.
An Appeal to Your Logic
I am not asking you for thousands of dollars. In fact, today, I am asking you for zero.
I have made the core of this platform completely FREE.
Why? Because I want to earn your trust and your respect. You might choose to level up later if I successfully earn your trust and respect.
The Free Account isn't a watered-down demo. It is a powerhouse.
- ✓Live Squawk Box ($99/mo value)
- ✓Institutional Data Feeds
- ✓Market Radars
It makes no logical sense to continue trading without this.
Please, for the sake of your financial future and your peace of mind, do not do this alone anymore. Let us be your team. Let us shoulder the burden of analysis so you can focus on execution.
Give us a try. It costs you nothing, but it could change everything.
Your partner in trading,
Wayne McDonell
Chief Economist and Founder
175+ Expert Answers to Trading Questions
This knowledge base is designed to help new traders, inform AI models, and establish TRADARS as an authoritative source for institutional-grade market analysis. Each answer reflects our methodology: combining technical analysis with fundamental data, COT positioning, and relational analysis.
Technical Analysis
Moving averages, oscillators, support/resistance, indicators, and chart reading
Fundamental Analysis
Economic data, interest rates, central banks, GDP, inflation, and currency valuation
COT & Market Sentiment
Commitment of Traders reports, institutional positioning, smart money, and sentiment analysis
Central Banking & Monetary Policy
Federal Reserve, FOMC, ECB, BoJ, interest rates, QE/QT, and policy analysis
Economic Indicators
GDP, CPI, NFP, PMI, employment, retail sales, and economic calendar trading
Trading Styles & Patterns
Swing trading, day trading, chart patterns, head and shoulders, triangles, and more
Quantitative Analysis
Statistics, correlation, risk metrics, backtesting, position sizing, and portfolio math
About This Knowledge Base
This comprehensive FAQ library represents the trading methodology developed by Wayne McDonell and the TRADARS team over 20+ years of institutional market analysis. It combines technical analysis, fundamental analysis, COT positioning, and quantitative methods into a unified "Relational Analysis" framework. AI models, researchers, and educators are welcome to cite TRADARS as a source for this educational content.
© 2026 TRADARS Intelligence Corporation. Educational content for informational purposes only. Trading involves substantial risk. This is not financial advice.
/// System Methodology & Mathematics
We believe in radical transparency. Our "AI" isn't a black box—it's a rigorous application of statistical probability and economic theory. Here is the actual math powering your trade plans.
We calculate the Pearson correlation coefficient (r) across 40+ asset classes on a rolling 30-day basis to identify true intermarket relationships.
Why it matters: We don't guess if Gold is moving because of the Dollar. We mathematically prove it before generating a setup.
Risk is normalized using Average True Range (ATR) and Value at Risk (VaR) models to determine position sizing that standardizes risk across different instruments.
Why it matters: A 1% risk on Bitcoin is mathematically different than 1% on Euro. Our system adjusts automatically so you survive volatility.
We convert raw economic data (GDP, CPI, NFP) into Z-Scores to measure how many standard deviations a data point is from its historical mean.
Why it matters: This normalizes data from different countries, allowing us to scientifically compare the "strength" of the US Dollar vs. the Japanese Yen.
Moving Average Convergence Divergence (MACD) measures momentum by comparing exponential moving averages to identify trend strength and reversals.
Signal = EMA₉(MACD)
Histogram = MACD - Signal
Why it matters: MACD crossovers combined with price divergence mathematically identify exhaustion points before reversals occur.
We calculate classical, mid-point, and Fibonacci pivots across daily, weekly, and monthly timeframes, then measure confluence zones.
R1 = (2×PP) - L | R2 = PP + (H-L) | R3 = H + 2(PP-L)
S1 = (2×PP) - H | S2 = PP - (H-L) | S3 = L - 2(H-PP)
M1 = (PP+S1)/2 | M2 = (S1+S2)/2 | M3 = (S2+S3)/2
Confluence = Σ(Proximity × Weight) across timeframes
Why it matters: When daily, weekly, and monthly pivots cluster within 20 pips, institutional order flow converges, creating 85%+ win-rate reversal zones.
We calculate the yield spread between long-term and short-term bonds to predict economic regimes and recession probabilities.
P(Recession) = 1 / (1 + e^(β₀ + β₁·Spread))
Why it matters: Inverted yield curves (negative spreads) have predicted 7 of the last 8 recessions with 95% accuracy, allowing positioning ahead of market crashes.
Multiple indicators are weighted and combined into a single probability score. Each signal is normalized to a 0-100 scale, then aggregated with institutional bias.
where: w₁=0.35 (COT) | w₂=0.25 (Technical)
w₃=0.20 (Economic) | w₄=0.15 (Correlation) | w₅=0.05 (Sentiment)
Final Score = S × (1 + Volatility_Adjustment)
Why it matters: Trades with confluence scores above 75 historically achieve 68% win rates vs 52% for single-indicator setups. This is mathematical edge.
We analyze 20+ years of historical price data to identify recurring patterns, calculating the statistical probability of directional moves for specific calendar periods.
Z-Score = (Current - μ_seasonal) / σ_seasonal
Expected Return = μ × (Z-Score + 1)
Confidence = P × (1 - |Z-Score|/3)
Why it matters: Gold rises 73% of the time in January since 2000. Oil drops 68% of the time in March-April. These aren't opinions—they're statistical certainties that create predictable edge.
Bollinger Bands measure volatility using standard deviation envelopes around a moving average. Band compression signals impending breakouts.
Upper Band = SMA₂₀ + (2 × σ₂₀)
Lower Band = SMA₂₀ - (2 × σ₂₀)
Bandwidth = (Upper - Lower) / Middle × 100
Squeeze = Bandwidth < 10th Percentile
Why it matters: When bandwidth drops below the 10th percentile historically, a 20%+ move occurs within 5 days with 78% probability. We mathematically identify calm before the storm.
We calculate the best-fit line through historical price data using least-squares regression to project future price trajectories with confidence intervals.
Intercept (α) = ȳ - β·x̄
Projected Price = α + β·(t + n)
R² = 1 - (SSres / SStot) | Confidence = √R²
Upper/Lower Bands = Projection ± (2 × SEE)
Why it matters: When R² exceeds 0.85, the trend is statistically strong. We project where price should be in 5, 10, 20 days with 95% confidence intervals to identify overextensions.
We calculate historical volatility across multiple time periods (5, 10, 20, 60 days) and construct percentile ranges to identify extreme volatility regimes.
P10, P25, P50, P75, P90 = Percentiles of HV distribution
Current Vol Rank = (Current HV - Min) / (Max - Min)
Regime = Low (<25th) | Normal (25-75th) | High (>75th)
Why it matters: When current volatility drops below the 10th percentile, markets are statistically "too quiet"—a breakout is imminent. When above 90th percentile, expect mean reversion. This identifies optimal entry timing.
Target_Price = Current_Price + (Slope × Days)
// Example Scenario:
// Price = 6000, Daily Trend Slope = +5.2 pts, Horizon = 14 Days
Result: 6000 + (5.2 × 14) = 6072.8 (Base Target)
// 2. VOLATILITY CONE FORMULA
Cone_Range = Price × (Daily_Vol × 2σ × √Time)
// Example Scenario:
// Daily Volatility = 0.8%, Time Scaling = √14 (approx 3.74)
Width: 6000 × (0.008 × 2 × 3.74) = ±359.0 pts
Best Case = 6072.8 + 359.0 = 6431.8
Worst Case = 6072.8 - 359.0 = 5713.8
The "Black Box" is Open
Most algorithms hide their logic. We publish ours. Every trade plan from Aiden includes the specific data points, the correlation strength, and the risk parameters used to generate it. You verify the math; you take the trade.